RMON (Remote Monitoring)
is a standard monitoring specification that enables various network
monitors and console systems to exchange network-monitoring data.
The RMON specification defines
a set of statistics and functions that can be exchanged between RMON-compliant console managers
and network probes. RMON provides
network administrators with comprehensive network-fault diagnosis,
planning, and performance-tuning information.
To access RMON screens, go to .
RMON Basic Settings
By
default, the tab RMON displays the RMON
Basic Settings screen.
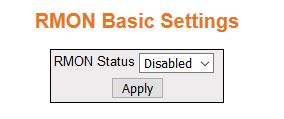
Figure 1. RMON Basic Settings
| Screen Objective |
This screen allows the user to configure the RMON status. Once the status is
enabled, monitoring of remote networks starts and data for storage
in the table is collected. |
| Navigation |
|
| Fields |
- RMON Status Map Name—select
the RMON status of the switch.
The default is Disabled. The drop-down list contains:
- Enabled—enables RMON in the switch.
- Disabled—disables RMON of
the switch. When disabled, the RMON’s network
monitoring is called off.
|
| Buttons |
- Apply—modifies
attributes and saves the changes.
|
RMON Alarm Configuration
Figure 2. RMON Alarm Configuration

| Screen Objective |
This screen allows the user to configure RMON alarm settings. The Alarm
group periodically takes statistical samples from variables in the
probe and compares them to thresholds that have been configured.
This is done to raise an alarm when the specified alarm condition
occurs. |
Note: RMON Events must be configured
before Alarms can be configured
|
| Navigation |
|
| Fields |
- Select—select
the index to modify the attributes of the selected entry.
- Index—enter the value of RMON alarm table index. The index
value uniquely identifies an entry in the alarm table. Each such
entry defines a diagnostic sample at a particular level for a MIB object in the device. This
value ranges from 1 to 65535.
- Interval—enter the time interval in seconds
for which the alarm monitors the MIB object
variable. It is during this interval the data is sampled and compared
with the rising and falling thresholds. This value ranges from 1
to 65535.
- Variable—enter the MIB object variable for which the
alarm is set. For successful configuration, the variable has to
be a valid Object ID.
Note: This Object ID value refers
to the OID of a particular variable in the RMON MIB that is to be monitored by
the alarm entry.
- Sample Type—select
the sample type to be compared against the thresholds. The default
option is Absolute value. The list contains:
|
| Fields(cont) |
- Absolute value—compares the
value of the selected variable directly with the thresholds at the
end of the sampling interval.
- Delta value—subtracts the value of the selected variable at
the last sample from the current value and compares the difference
with the thresholds at the end of the sampling interval.
- Rising Threshold—enter the Rising Threshold
value. This value ranges from 0 to 2147483647.
Note: If the start-up
alarm is set as Rising alarm or Rising Or Falling alarm and if the configured
threshold value is reached, then an alarm is raised.When the current sampled
value is greater than or equal to the configured Rising threshold,
and the value at the last sampling interval is less than this configured
threshold, a single event will be generated.
- Falling Threshold—enter the Falling Threshold
value. This value ranges from 0 to 2147483647.
Note: The Falling
Threshold value should be lesser than the Rising threshold value.If
the start-up alarm is set as Falling alarm or Rising Or Falling
alarm and if the configured threshold value is reached, then an
alarm is raised.When the current sampled value is lesser than or
equal to the configured Falling threshold, and the value at the
last sampling interval is greater than this threshold, a single event
will be generated.
- Rising Event Index—enter the index of
the event to be raised when the Rising threshold is reached. This
value ranges from 1 to 65535.
Note: The value of this field is same
as Event Index in RMON Events
Configuration.
- Falling Event Index—enter the index of
the event to be raised when the Falling threshold is reached. This
value ranges from 1 to 65535.
Note: The value of this field is same
as Event Index in RMON Events
Configuration.
- Owner—enter the entity details that configured
this entry and is using the resources assigned to it.
- Alarm Value—displays the value of the
statistic during the last sampling period. This value remains available
until the current sampling period is completed. For example, if
the sample type is deltaValue, this value will be the difference between
the samples at the beginning and end of the period. If the sample
type is absoluteValue, this value will be the sampled value at the
end of the period. This value is compared with the rising and falling
thresholds.
- Startup Alarm—displays the alarm that
is sent when the entry is set as valid for the first time. The list
contains:
- RisingAlarm—denotes that the first sample after
the entry becoming valid is greater than or equal to the rising
threshold.
- FallingAlarm—denotes that the first sample after the entry becoming
valid is less than or equal to the falling threshold.
- RisingOrFallingAlarm—denotes that either Rising or Falling Alarm
is sent based on the sample in comparison with the rising and falling
threshold.
|
| Fields (cont) |
- Status—select
the required status of alarm. The list contains:
- Valid—sets
the status as Valid if the entry is completely created.
- Under Creation—sets the status as Under Creation if the entry
is created and not completely configured
- Entries in this state are not fully active. Entries exists in
the “Under Creation” state until the management station has finished
configuring the entry and sets this object to valid or invalid state.
- Invalid—sets the status as Invalid if the entry is removed.
It also effectively disassociates the mapping identified with the
entry.
Note: While creating a new RMON alarm entry, for invalid configurations,
an error message is displayed, and the status is set as Under Creation.
|
| Buttons |
- Apply—modifies
attributes and saves the changes.
- Reset—resets to default value for respective
fields and discards all user input.
- Apply—modifies attributes and saves the
changes.
|
Ethernet Statistics Configuration
Figure 3. Ethernet Statistics Configuration

| Screen Objective |
This screen contains statistics measured by
the probe for each monitored interface on the device. The statistics
in this group reflects all packets on the local network segment attached
to the identified interface |
| Navigation |
|
| Fields |
- Select—select
the index to modify the attributes of the selected entry.
- Index—enter the Ethernet Statistics index
that uniquely identifies an entry in the Ethernet Statistics table.
This value ranges from 1 to 65535.
|
| Fields (cont) |
- Data Source—enter
the SMNP object ID of the variable
on which the statistics is being collected. This object identifies
the instance of the ifIndex object. For successful configuration
the Data Source has to be a valid Object ID.
Note: For e.g. 1.3.6.1.2.1.2.2.1.1.1
Index or 1.3.6.1.2.1.17.7.1.4.2.1.2.1 Index. Here, the value of
Index depends upon the number of ports/VLAN created.
- Owner—enter the details of the entity
that configured this entry and is using the resources assigned to
it.
- Drop Events—displays the number of events
in which the packets were dropped by the probe due to lack of resources.
This number does not specify the number of packets dropped but the
number of times the packets were dropped
- Octets—displays the total number of octets
of data received from the network (excluding the framing bits but
including FCS octets). This can
be used as a reasonable estimate of 10-Megabit Ethernet utilization.
- Packets—displays the total number of
packets received from the network. This includes bad packets, broadcast
packets and multicast packets received.
- Broadcast Packets—displays the total
number of packets received that were directed to the broadcast address.
- Multicast Packets—displays the total
number of packets that were directed to the multicast address.
- Status—select the required status of
event. The list contains:
- Valid—sets the status as Valid
if the entry is completely created.
- Under Creation—sets the status as Under Creation if the entry
is created and not completely configure
Note: Entries in this
state are not fully active. Entries exists in the Under Creation
state until the management station has finished configuring the entry
and sets this object to valid or invalid state.
- Invalid—sets the status as Invalid if the entry is removed.
It also effectively disassociates the mapping identified with the
entry.
|
| Buttons |
- Apply—modifies
attributes and saves the changes.
- Reset—resets to default value for respective
fields and discards all user input.
- Apply—modifies attributes and saves the
changes.
|
Event Configuration
Figure 4. Event Configuration

| Screen Objective |
This screen contains statistics measured by
the probe for each monitored interface on the device. The statistics
in this group reflects all packets on the local network segment attached
to the identified interface |
| Navigation |
|
| Fields |
- Select—select
the index to modify the attributes of the selected entry.
- Event Index—enter a number that uniquely
identifies an entry in the Event Configuration table. Each such
entry defines one event that is to be generated when appropriate
conditions occur. This value ranges from 1 to 65535.
- Description—enter a brief description
of the event—a string of maximum size 127.
Note: This field value
accepts only Characters and number.
- Type—select the type of event to be configured.
This is the type of notification that the probe makes about this
event. The list contains:
- Log—creates an entry in the log
table for each event.
- SNMP Trap—sends an SMNP trap
to one or more management stations.
- Log and Trap—creates an entry in the log table and sends an SMNP trap.
- None—sets the event type as None—no notifications are sent.
Note: This
field value accepts only Characters and number.
- Community—enter SMNP community
string to which the SMNP trap
is to be sent.
Note: This is relevant when an SMNP trap is requested for an event.
- Owner—enter the entity that configured
this entry and is using the resources assigned to it.
- Last Time Sent—displays the time this
event entry last generated an event. If this entry has not generated
any events, the value will be zero.
|
| Fields (cont) |
- Status—select
the required status of anevent. The list contains:
- Valid—sets
the status as Valid if the entry is completely created.
- Under Creation—choose if an entry is created but not quite configured.
Note: Entries
in this state are not fully active and exist in this state until
the management station has finished configuring the entry and the
object is set to valid or invalid state.
- Invalid—sets
the status as Invalid if the entry is removed. It also effectively
disassociates the mapping identified with the entry.
|
| Buttons |
- Apply—modifies
attributes and saves the changes.
- Reset—resets to default value for respective
fields and discards all user input.
- Apply—modifies attributes and saves the
changes.
|
History
Figure 5. History
Control Configuration

| Screen Objective |
This screen allows the user to configure RMON history settings. The History
module controls the periodic statistical sampling of the data collected
by statistics module from various types of networks. This module
stores the sample collected from the etherstat table in etherHistory
table. |
| Navigation |
|
| Fields |
- Select—select
the index to modify the attributes of the selected entry.
- Index—enter an integer value to identify
an entry in the History Control Table. Each such entry defines a
set of samples at a particular interval for an interface on the
device. This value ranges from 1 to 65535.
|
| Fields (cont) |
- Data Source—enter
the SMNP object ID of the variable
on which the statistics is being collected. This object identifies
the instance of the ifIndex object. For successful configuration
the Data Source has to be a valid Object ID.
Note: For e.g. 1.3.6.1.2.1.2.2.1.1.1
Index or 1.3.6.1.2.1.17.7.1.4.2.1.2.1 Index. Here, the value of
Index depends upon the number of ports/VLAN created.
- Buckets Requested—enter the number of
buckets to be configured for collecting the RMON statistics,
that is, the requested number of discrete time intervals over which
data is to be saved in the part of the media-specific table associated
with this entry. This value ranges from 1 to 65535. The default
value is 50.
- Interval—enter the time interval (in
seconds) over which the data is sampled for each bucket to collect
the statistics. This value ranges from 1 to 3600 seconds. The default
value is 1800 seconds.
- Owner—enter the details of the entity
that configured this entry and is using the resources assigned to
it.
- Buckets Granted—displays the number of
buckets granted for collecting the RMON statistics.
This is the number of discrete sampling intervals over which data shall
be saved in the part of the media-specific table associated with
this History Control Entry. This value ranges from 1 to 65535. This
is a read-only field.
- Status—select the required status of
event. The list contains:
- Valid—sets the status as Valid
if the entry is completely created.
- Under Creation—sets the status as Under Creation if the entry
is created and not completely configure
Note: Entries in this
state are not fully active. Entries exists in the Under Creation
state until the management station has finished configuring the entry
and sets this object to valid or invalid state.
- Invalid—sets the status as Invalid if the entry is removed.
It also effectively disassociates the mapping identified with the
entry.
|
| Buttons |
- Apply—modifies
attributes and saves the changes.
- Reset—resets to default value for respective
fields and discards all user input.
- Apply—modifies attributes and saves the
changes.
|